Aside

Cisco Live Runs on FlexPod

NetApp and Cisco have a long and well-regarded partnership, with the joint FlexPod offering being the best known and marketed. The collaboration between the companies often extends in less well-advertised but no less interesting ways. One that has been a personal highlight for me is NetApp providing the storage for the infrastructure that runs the Network Operations Center (NOC) for five of the last Cisco Live events in the US and Europe. This includes acting as a member of the NOC team both prior to the show and during the event: NetApp personnel arrive with Cisco staff the week before the show begins to setup the environment, and ensure that everything runs smoothly and non-disruptively for the attendees.

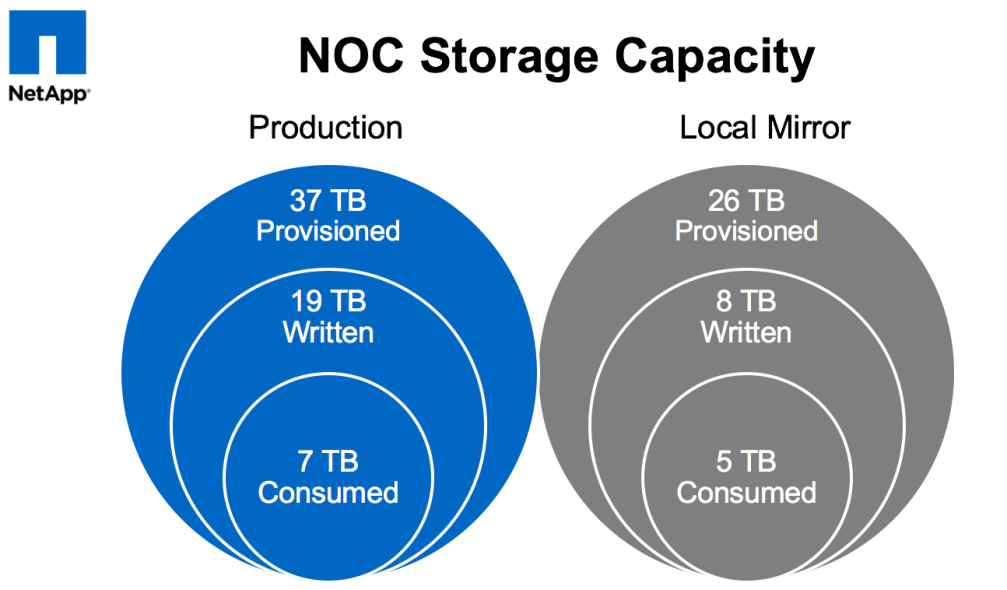
The core infrastructure – comprised of FlexPods as we leverage Cisco Nexus switches and UCS servers in conjunction with our NetApp FAS storage – has been relatively small: less than 20 servers and and less than 50TB of provisioned storage.  From a sheer numbers perspective, the majority of the equipment managed by the NOC team is at the edge: 500+ switches and 600-900 wireless access points. (Any and all numbers vary by year and by location. YMMV.) What is common to all of this infrastructure: it must be able to be stood up quickly once on site, it must perform well (as the large number of attendees do their best to test the limits of the environment – whether accidentally or deliberately), and, most importantly, it must be highly reliable and can not go down.


When we started it was with classic 7-mode systems: a mid-range FAS3200 series HA pair with several shelves of SAS drives for production on-site at the event, and a secondary FAS2200 series HA pair for DR and co-located services. Both systems worked well supporting the virtual infrastructure powering the event.


CLUS2014

In 2014 we upgraded the production hardware to a FAS8000 series running clustered Data ONTAP along with some new disk shelves. Flash Cache was also included to assist with things like VDI – that year the NOC provided virtual desktops for many of the labs that were being performed at the show. The system continued to work well with zero downtime or performance issues, and providing significant storage efficiencies. We had so much extra space due to NetApp dedupe, thin provisioning, etc. that we even mirrored most data locally between the controllers to provide yet-another level of redundancy (belts, suspenders, and safety pins).

CLUS2015_NOC_capacity


Now we’ve upgraded again: starting with this week’s Cisco Live Europe show in Berlin, the Cisco Live NOC runs on an AFF MetroCluster!

What’s AFF?  AFF stands for “All-Flash FAS” – this is the flash-only version of NetApp’s storage controllers that run clustered Data ONTAP: specifically optimized for low-latency flash performance. While sharing the same OS with our traditional FAS storage arrays enables customers to get all of the benefits of our rich family of integrated data management services, there are now software optimizations for flash that are only enabled in the AFF series, and those optimizations are already showing significant improvements across minor version releases (8.3.0 -> 8.3.1 -> 8.3.2).

Why AFF?  …. why not? During last year’s Cisco Live US we found that the IO load on the existing back-end disks was approaching the point at which contention and undesirable latency would start to be introduced. While the controllers themselves could produce more performance, we would have needed to add more disk shelves in order to provide any significantly increased amount of IOPS. Because we were not capacity bound, it made much more sense to instead replace the SAS drives with SSDs for the best performance possible and the most room for growth (in IO). We could have kept the existing FAS controllers to use with new SSDs – many of our FAS customers have been using hybrid or all-SSD configurations for years – but there was no good reason to not also take advantage of the performance improvements specific to the AFF line of controllers.

What’s MetroCluster? It’s an implementation of NetApp’s FAS (or AFF) storage controllers that provides high availability and disaster recovery across physical sites with zero data loss (zero RPO – recovery point objective) and minimal downtime (low to near-zero RTO – recovery time objective).  In order to achieve zero data loss, of course, you must be performing synchronous writes to two different sets of physical media, and for disaster recovery those sets must be in different physical locations. Because the speed of light is a real limit, in order to perform synchronous writes those two locations need to be relatively near each other so that the round-trip time latencies are acceptable (the controller can’t acknowledge a write operation back to the host until that write is committed at the remote site, not just the local site).  With a maximum supported distance of 200km (for now) you get a cluster that can operate across a “metropolitan” area. Customers have been using MetroCluster to protect their most mission critical data in this fashion for 10 years now.

So why MetroCluster? As I noted above, we had been replicating most of the Cisco Live data locally for an extra level of protection anyway, but, more importantly, for Cisco Live Europe a different need arose: active/active storage across two physical locations. At prior shows, the completely redundant FlexPod environments (as shown in the diagram above) had been located proximal to each other. For the 2016 show the goal was to take advantage of the building layouts at the new location (City Cube in Berlin) to provide even more redundancy by placing half of the infrastructure in each of two different buildings (one FlexPod per building). Very early in these planning stages it became obvious that using an AFF MetroCluster for Cisco Live was simply the right thing to do.


We’re now a few days into Cisco Live Europe 2016, and things are going well. On Friday we’ll be having the traditional NOC panel during the last session slot of the show where we’ll discuss the build-out, how the entire infrastructure (wired, wireless, WAN, datacenter, etc.) has performed, lessons learned, and any interesting statistics.  I’ll also post a follow-up blog about my experiences at the show.

For now, here’s a pic of one of the FlexPods (one half of the core datacenter infrastructure) as we were getting it plugged in on the first day. This was before it was powered on – hence the lack of blinkenlights.

NOC_FlexPod


Cisco Champions 2016: NetApp Honorees

On Friday January 29th, Cisco welcomed this year’s honorees for the Cisco Champions 2016 program. While the complete list of award winners has not yet been published, I’m proud to be able to say I’ve been chosen a Champion for the second year.  And yes, even prouder to see other NetApp/Solidfire employees and “extended family” on the list:

  • Chris Reno (@thechrisreno), National Pre-Sales Engineer at ePlus, Inc
  • Dave Cain (@thedavecain), TME for Converged Infrastructures at NetApp
  • Henry Vail, Senior Architect for Converged Infrastructures at NetApp
  • Jarett Kulm (@JK47theweapon and jk-47.com), Principal Technologist at HA Storage Systems and NetApp A-Team member
  • Melissa Palmer (@vmiss33 and vmiss.net), TME for Converged Infrastructures at NetApp
  • Pete Ybarra (@CertiPete), Field Technical Consultant at Avnet and NetApp A-Team member
  • Shawn Lieu (@ShawnLieu), Solutions Architect at Veeam and NetApp A-Team member

If there’s anyone that I’ve missed in the above list, please let me know and I’ll be happy to update & make sure that you’re included.

While a much younger program than the VMware vExpert one, the team at Cisco have done a fantastic job of ramping up quickly and truly building a thriving and interactive community. All the success of the program is due to the hard work, passion, and openness of the both program’s current leaders, Lauren Friedman (@Lauren) and Brandon Prebynski (@Prebynski), and its former stewards, Amy Lewis (@CommsNinja – now Director of Marketing for Solidfire at NetApp) and Rachel Bakker (@RBakker).

CiscoChampion2016_small

VMware vExpert 2016: NetApp Honorees

Last Friday VMware released the official list of the honorees for the VMware vExpert 2016 program. I’m proud to have been chosen for this award for the third year, and even prouder to see how many other NetApp employees, including our new Solidfire brethren, and “extended family” are on the list:

  • Chris Gebhardt (@chrisgeb), vTME and Dr. Desktop, Lord of EUC at NetApp
  • Henry Vail, Senior Architect for Converged Infrastructures at NetApp
  • Joel Kaufman (@thejoelk), TME Director for manageability at NetApp
  • Kyle Murley (@kylemurley), Systems Engineer for Solidfire at NetApp
  • Melissa Palmer (@vmiss33 and vmiss.net), TME for Converged Infrastructures at NetApp
  • Shawn Lieu (@ShawnLieu), Solutions Architect at Veeam and NetApp A-Team member

If there’s anyone that I’ve missed in the above list, please let me know and I’ll be happy to update & make sure that you’re included.

 VMW-LOGO-vEXPERT-2016-k

Tours of the Black Prompt: NetApp FAS Service Processors

The Tours of the Black Prompt series so far:

Over the course of this series, we’ve focused on the command line interface available for the operating systems that run on NetApp FAS storage array controllers: Data ONTAP 7-mode and clustered Data ONTAP. In this post, we’ll focus on a CLI that is not part of the operating system: the Service Processor shell.


Service Processor Shell

NetApp FAS array controllers have had built-in out-of-band management for many years. Depending on the series, older FAS models have used either baseboard management controllers (BMC) or remote LAN management (RLM) ports for this functionality. The newer FAS models, including the 2200, 3200, 6200, and 8000 series, all use a service processor (SP) for out-of-band management. BMCs, RLMs, and SPs offer similar base functionality, but SPs provide the most capabilities and features. The SP CLI behavior described below is the same regardless of whether the controller connected to the SP is running 7-mode or clustered Data ONTAP.

Commands and Privilege Levels

Logging in via SSH (telnet is not supported) you are provided a simple administrative-level prompt:

SP>

The prompt is very minimal and only indicates that you are connected to a Service Processor (the “SP” in the prompt) at the normal administrative privilege level (the “>” in the prompt). This is of course very similar to the Data ONTAP shell prompts but without the cluster or hostname being designated.

From here, you can see the available command structure by simply typing either “?” or help followed by [Enter] :

SP> ?
 date - print date and time
 exit - exit from the SP command line interface
 events - print system events and event information
 help - print command help
 priv - show and set user mode
 sp - commands to control the SP
 rsa - commands for Remote Support Agent
 system - commands to control the system
 version - print Service Processor version
 
SP> help
 date - print date and time
 exit - exit from the SP command line interface
 events - print system events and event information
 help - print command help
 priv - show and set user mode
 sp - commands to control the SP
 rsa - commands for Remote Support Agent
 system - commands to control the system
 version - print Service Processor version

As you can see, there are far fewer commands available for the SP than there are for either version of Data ONTAP. The SP CLI is limited to functionality necessary or useful for situations that require out-of-band access.

For the vast majority of times that an administrator will be connecting to the Service Processor, they will be using it for the most basic functionality: serial console access using the system console command.

SP> system console
 Type Ctrl-D to exit.
 SP-login: admin
 Password:
 *****************************************************
 * This is a SP/RLM console session. Output from the *
 * serial console is also mirrored on this session.  *
 *****************************************************
cluster01::>

Connecting to the system console does require a secondary authentication. While the built-in admin or root user (depending on the version of Data ONTAP) are allowed to login to the SP by default, it is possible for other users to be configured for access to the SP who may or may not be allowed console access to Data ONTAP.

At this point, the SP session will be able to see all output visible to the physical serial port, as well as being able to provide any input to it. Access via system console is not restricted or limited in any way; access and capabilities are only limited by the configuration of the user.

While the SP console session and the physical serial console session do display some of the same information, they still have separate and independent shell environments. If, while an SP session is connected to the system console, there is a concurrent connection to the physical serial port, any input or output from that console session would be mirrored to the SP session. The inverse, however, is not true: any input or output initiated from the SP session will not be visible to the physical console session.

Pressing Ctrl+d from the SP session will end the system console access and return the administrator to the SP CLI prompt.

cluster1::> SP>

The SP itself can also be accessed from the physical serial port by pressing Ctrl+g. This is useful where an administrator is using either a console/terminal server for centralized out-of-band management, or when connected directly to the console (such as during initial setup). The administrator can then return to the serial console by pressing Ctrl+d.

cluster1::>

Switching console to Service Processor
Service Processor Login:
Password:
SP>

cluster1::>

Just like Data ONTAP, there are two additional privilege levels available: advanced and diag. You can change to these levels using the priv set command.

SP> priv set advanced
 Warning: These advanced commands are potentially dangerous; use them only when directed to do so by support personnel.
 
SP*>

The asterisk between the “SP” and “>” indicates that you are in either the advanced or diag privilege level.  There is unfortunately no visual distinction between these two levels, but you can run the priv command with no modifiers to display the current privilege level. This is again just like with Data ONTAP.

SP*> priv
 advanced

More commands are available within the higher privilege levels than in the normal admin level, though they are not necessarily obvious from the top-level output.

Advanced
SP*> ?
 date - print date and time
 exit - exit from the SP command line interface
 events - print system events and event information
 help - print command help
 priv - show and set user mode
 sp - commands to control the SP
 rsa - commands for Remote Support Agent
 system - commands to control the system
 version - print Service Processor version

There are several commands available in Advanced level that aren’t in the normal Admin level, with most being for the display of additional information:

  • sp log audit to display the command history of the SP
  • sp log debug to display the debug information of the SP
  • sp log messages to display the contents of the messages file for the SP
  • system battery auto_update status to display the current setting for the battery firmware automatic updates
  • system fru log show to display the history log related to FRU data

There are also several commands to modify or verify the SP configuration:

  • system battery auto_update [enable|disable] to configure the setting for the battery firmware automatic updates
  • system battery verify [URL] to compare the current battery firmware image with another image available at the specified URL
  • system nvram flash clear to erase the NVRAM flash content (only available when the system is powered on)
Diag
SP*> priv set diag
 Warning: These diagnostic commands are for use by support personnel only.
 
SP*> ?
 date - print date and time
 exit - exit from the SP command line interface
 events - print system events and event information
 gdb - commands to control GDB pass-through
 help - print command help
 priv - show and set user mode
 sp - commands to control the SP
 rsa - commands for Remote Support Agent
 system - commands to control the system
 version - print Service Processor version
 ping - send ICMP ECHO_REQUEST packets to network hosts
 ping6 - send ICMPv6 ECHO_REQUEST packets to network hosts
 traceroute - trace route to HOST
 nslookup - query the nameserver for the IP address of the given HOST optionally using a specified DNS server

The most useful commands at the diag privilege level may be the most basic for troubleshooting network connectivity:

  • ping and ping6
  • traceroute
  • nslookup

Command Syntax and Help

You can see the syntax for a given command by passing it the “-?” or “?” flag, or by using the help command:

SP> events ?
 events all - print all system events
 events info - print system event log information
 events newest - print newest system events
 events oldest - print oldest system events
 events search - search for and print system events
 
SP> events -?
 events all - print all system events
 events info - print system event log information
 events newest - print newest system events
 events oldest - print oldest system events
 events search - search for and print system events
 
SP> help events
 events all - print all system events
 events info - print system event log information
 events newest - print newest system events
 events oldest - print oldest system events
 events search - search for and print system events

The information available for the SP CLI commands is not as verbose and detailed as for Data ONTAP, and manual pages are unfortunately not available. The best source of more information for SP commands will be found in the System Administration Guide for the appropriate Data ONTAP release.

Command Completion

Tab completion is not available for the SP CLI, nor can you abbreviate commands. All commands must be fully entered in order for them to be recognized.

Navigation and Editing

Command-line editing and navigation utilizes the standard keystrokes and combination previously discussed in CLI Efficiency: Common Basics

You can navigate through your previously entered commands using the up and down arrows, or by using Ctrl+n and Ctrl+p, but there is no history command for the SP CLI. It is also worth noting that SP commands entered prior to accessing a system console session will not be displayed after returning to the SP CLI prompt.

Just like with Data ONTAP, you can enter multiple commands on the same command line by separating each command with a semi-colon. The commands will then be executed in order of entry.

SP*> priv; date
 diag
 
 Sun Nov  30 02:10:02 GMT 2014

As you’ll have noticed, the Service Processor shell has an interface similar to and consistent with the Data ONTAP 7-mode shell despite the different use cases for each.

In a future article, I’ll go into more details around SP setup, configuration and usage beyond the basics described in this post.

Tours of the Black Prompt: Clustered NetApp Data ONTAP – Part 6

The Tours of the Black Prompt series so far:

In this entry in the series, we’ll take a brief look at the different shells available within clustered Data ONTAP.

Clustershell

Everything we’ve discussed in Part 1 through Part 5 of this series has been using the clustershell. This is the primary interface for cluster management from the command line, and it is expected that the vast majority of the administrator’s work in the CLI will be using this shell (95%+). The clustershell is what the administrator is automatically using when connecting to a cluster, regardless of whether that connection is to the cluster management interface, a node management interface, or a Storage Virtual Machine management interface. The clustershell manages objects and configurations for the entire cluster.

Nodeshell

The nodeshell is a more limited shell for commands that only effect an individual node. This shell is equivalent to the one used for Data ONTAP operating in 7-mode where each controller operated as an independent node despite being able to provide high-availability for its partner.

Nodeshell commands are accessible from the clustershell using the system node run command (or any of its abbreviated forms like node run, run, or even ru). We’ve shown several examples of this usage over the previous five parts of this series.

You can see what commands are available in the nodeshell using either “?” or the help command:

cdot_mba1::> run local -command ?
 ?                   file                partner             software           
 acpadmin            flexcache           passwd              source             
 aggr                fsecurity           ping6               sp                 
 backup              halt                pktt                stats              
 bmc                 help                priority            storage            
 cdpd                hostname            priv                sysconfig          
 cf                  ic                  qtree               sysstat            
 clone               ifconfig            quota               timezone           
 date                ifgrp               rdfile              ups                
 dcb                 ifstat              reallocate          uptime             
 df                  key_manager         restore             version            
 disk                keymgr              restore_backup      vlan               
 disk_fw_update      license             revert_to           vmservices         
 download            logger              rlm                 vol                
 dump                man                 route               wcc                
 echo                maxfiles            rshstat             wrfile             
 ems                 mt                  sasadmin            ypcat              
 environment         ndmpcopy            sasstat             ypgroup            
 fcadmin             netstat             sis                 ypmatch            
 fcp                 options             snap                ypwhich            
 fcstat             
 
 cdot_mba1::> run local -command help
 
 ?                   file                partner             software           
 acpadmin            flexcache           passwd              source             
 aggr                fsecurity           ping6               sp                 
 backup              halt                pktt                stats              
 bmc                 help                priority            storage            
 cdpd                hostname            priv                sysconfig          
 cf                  ic                  qtree               sysstat            
 clone               ifconfig            quota               timezone           
 date                ifgrp               rdfile              ups                
 dcb                 ifstat              reallocate          uptime             
 df                  key_manager         restore             version            
 disk                keymgr              restore_backup      vlan               
 disk_fw_update      license             revert_to           vmservices         
 download            logger              rlm                 vol                
 dump                man                 route               wcc                
 echo                maxfiles            rshstat             wrfile             
 ems                 mt                  sasadmin            ypcat              
 environment         ndmpcopy            sasstat             ypgroup            
 fcadmin             netstat             sis                 ypmatch            
 fcp                 options             snap                ypwhich            
 fcstat             

The help command can also be used to get more information about a specific command, or you can pass the “-?” parameter to the command:

cdot_mba1::> run local -command help acpadmin
 
 acpadmin             - Storage ACP administrator functions

cdot_mba1::> run local -command acpadmin -?
 Usage: acpadmin configure
        acpadmin list_all
        acpadmin stats

Running just a command without parameters will actually provide the same information as using the “-?” parameter:

cdot_mba1::> run local -command acpadmin
 Usage: acpadmin configure
        acpadmin list_all
        acpadmin stats

As you may have noticed from our examples in the earlier parts of the series, you don’t need to use the “-command” parameter at all but can just specify the command directly:

cdot_mba1::> run local acpadmin
 Usage: acpadmin configure
        acpadmin list_all
        acpadmin stats

This works even for the help command to show the available nodeshell commands, though you can’t use the “-?” in the same fashion as it’s evaluated for the run local context instead:

cdot_mba1::> run local help   
 
 ?                   file                partner             software           
 acpadmin            flexcache           passwd              source             
 aggr                fsecurity           ping6               sp                 
 backup              halt                pktt                stats              
 bmc                 help                priority            storage            
 cdpd                hostname            priv                sysconfig          
 cf                  ic                  qtree               sysstat            
 clone               ifconfig            quota               timezone           
 date                ifgrp               rdfile              ups                
 dcb                 ifstat              reallocate          uptime             
 df                  key_manager         restore             version            
 disk                keymgr              restore_backup      vlan               
 disk_fw_update      license             revert_to           vmservices         
 download            logger              rlm                 vol                
 dump                man                 route               wcc                
 echo                maxfiles            rshstat             wrfile             
 ems                 mt                  sasadmin            ypcat              
 environment         ndmpcopy            sasstat             ypgroup            
 fcadmin             netstat             sis                 ypmatch            
 fcp                 options             snap                ypwhich            
 fcstat             
 
 cdot_mba1::> run local -?
   { [[-command] <text>, ...]  Command to Run
   | [ -reset [true] ] }       Reset Existing Connection

The nodeshell can also be used interactively by using the run clustershell command without appending a particular nodeshell command to run.

cdot_mba1::> run local                     
 Type 'exit' or 'Ctrl-D' to return to the CLI
 cdot_mba1-01> ?
 ?                   file                passwd              software           
 acpadmin            flexcache           ping                source             
 aggr                fsecurity           ping6               sp                 
 arp                 halt                pktt                stats              
 backup              help                priority            storage            
 bmc                 hostname            priv                sysconfig          
 cdpd                ic                  qtree               sysstat            
 cf                  ifconfig            quota               timezone           
 clone               ifgrp               rdfile              traceroute         
 coredump            ifstat              reallocate          traceroute6        
 date                key_manager         restore             ups                
 dcb                 keymgr              restore_backup      uptime             
 df                  license             revert_to           version            
 disk                logger              rlm                 vlan               
 disk_fw_update      man                 route               vmservices         
 download            maxfiles            rshstat             vol                
 dump                mt                  sasadmin            wcc                
 echo                ndmpcopy            sasstat             wrfile             
 ems                 ndp                 savecore            ypcat              
 environment         netstat             shelfchk            ypgroup            
 fcadmin             options             sis                 ypmatch            
 fcp                 partner             snap                ypwhich            
 fcstat             
 cdot_mba1-01>

Notice that the prompt changes once you’ve entered the nodeshell, and uses the same format as the 7-mode prompt (nodename followed by “>”).

 cluster01> priv set advanced
 Warning: These advanced commands are potentially dangerous; use
          them only when directed to do so by NetApp
          personnel.
 cdot_mba1-01*>

The same privilege levels (admin, advanced, and diag) are still applicable within the nodeshell, and the same indicators are used (the presence of the “*” between the nodename and the “>” indicates that the administrator is in either advanced or diag privilege level).

You return to the clustershell by typing exit or pressing Ctrl+d.

cdot_mba1-01*> exit
 logout
 
 cdot_mba1::>

While in the above example we were connecting to the nodeshell of the local node (the node where the cluster management interface was currently located), the administrator can connect to any node in the cluster as needed:

cdot_mba1::> run -node cdot_mba1-02
 Type 'exit' or 'Ctrl-D' to return to the CLI
cdot_mba1-02>

If you are connecting via the cluster management interface, you can identify which node you are connected to by finding the current home of the interface:

cdot_mba1::*> net int show cluster_mgmt
   (network interface show)
             Logical    Status     Network            Current       Current Is
 Vserver     Interface  Admin/Oper Address/Mask       Node          Port    Home
 ----------- ---------- ---------- ------------------ ------------- ------- ----
 cdot_mba1
             cluster_mgmt up/up    172.16.213.10/24   cdot_mba1-01  e0d     false

But there’s also a much simpler way using a nodeshell command:

cdot_mba1::*> run local hostname
 
 cdot_mba1-01
One final note: just as with the 7-mode shell, tab completion will not work for nodeshell commands, even when run from the clustershell rather than interactively.

Systemshell

The systemshell is a lower-level shell that provides access to the underlying FreeBSD layer of Data ONTAP, and is meant only for diagnostic or troubleshooting purposes. The systemshell should only be used under the guidance of NetApp technical support, particularly for production systems.

The systemshell can only be accessed from the diag privilege level.

cdot_mba1::> systemshell
 
 Error: "systemshell" is not a recognized command
 
 cdot_mba1::> set -priv diag
 
 Warning: These diagnostic commands are for use by NetApp personnel only.
 Do you want to continue? {y|n}: y
 
 cdot_mba1::*> systemshell
   (system node systemshell)
 
 Data ONTAP/amd64 (cdot_mba1-01) (pts/2)
 
 login: admin
 Password:
 Error: Account not configured to connect in this manner.
 
 
 cdot_mba1::*>

The systemshell does require explicit re-authentication, and by default the admin user is not allowed access. You need to login as the diag user instead which needs to be given a password and unlocked before it is usable.

cdot_mba1::*> security login password -username diag 
 
 Enter a new password:
 Enter it again:
 
cdot_mba1::*> security login unlock diag
 
cdot_mba1::*> systemshell
   (system node systemshell)
 
 Data ONTAP/amd64 (cdot_mba1-01) (pts/2)
 
 login: diag
 Password:
 
 
 Warning:  The system shell provides access to low-level
 diagnostic tools that can cause irreparable damage to
 the system if not used properly.  Use this environment
 only when directed to do so by support personnel.
 
 cdot_mba1-01%
The systemshell does not provide the same level of friendliness as the other shells, as the “?” and “help” options are not supported, and neither is tab completion.
cdot_mba1-01% echo $SHELL
 /bin/csh
cdot_mba1-01% pwd
 /var/home/diag
cdot_mba1-01% ?
 ?: No match.
cdot_mba1-01% help
 help: Command not found.
cdot_mba1-01% exit
 logout
 
 cdot_mba1::*>

Again, the systemshell is only to be used under the supervision of NetApp technical support while performing troubleshooting or diagnostic operations.


There is in fact one more shell that an administrator will interact with, and it’s used with both clustered Data ONTAP and 7-mode. The Service Processor shell runs on an independent sub-processor used only for out-of-band management, and accessible via a dedicated Ethernet interface. We’ll discuss it in detail in an upcoming post.