Seasonal Learning Opportunities 2015

This a brief update to last year’s post on good deals for our continuing quest to Always Be Learning.

The following are simply in alphabetical order, and I’m sure only represent the tip of the iceberg of good deals. Please share any others you hear about in the comments.

Books and Videos

Apress

Apress are offering a Cyber Monday sale of $10 each for any of their ebooks ($20 each for any of the Spring ebooks) until 11:59pm tonight, November 30th. The  site normally offers an Apress ebook Deal of the Day as well as a Springer Daily Deal.

CiscoPress

Cisco Press are having a Cyber Monday Sale with 55% off eligible items using code CM2015. This includes books, ebooks, video training, practice exams, and more. They also consistently offer eBook and Video Deals of the Week (from their home page).

Manning Publications

This year they’re again having a “Green Tuesday” sale until the end of November where all eBook purchases under $50 are 40% off (codegt112415acc) and purchases over $50 are 50% off (code gt112415bcc). They’re also having a “Countdown to 2016” sale during December with a different discount deal each day, a chance to win a free ebook each day, and a chance to win an Apple iPad Pro.

And of course they have a Deal of the Day selected from across their entire catalog (eBooks, physical/printed books, or “MEAPs” – Manning Early Access Program books similar to O’Reilly’s Rough Cuts where books are made available as chapters are completed).

O’Reilly

O’Reilly have been one of the premier publishers of IT books for decades, and in recent years have of course added ebooks, videos, and other media to their output. While O’Reilly have Ebook Deals of the Day (usually two) and Video Deal of the Week, their biggest sales are at this time of year.

Their Cyber Monday Sale is running again this year (till December 1st 5am PST) and you can score 50% off any ebook or video, or 60% off when ordering $100 or more. And remember – O’Reilly sell/distribute books by other publishers as well including No Starch Press, Wrox, Wiley, Sybex, and many others.

Even better, O’Reilly are the force behind SafariOnline, the premier tech ebook/video subscription service which is having its own Cyber Monday sale today: 50% off the normal annual subscription price of $399! So for $199 you can get an all-you-can eat tech buffet – this is one of the best deals out there if you consume (or want to consume) a large amount of tech content. And yes – it includes offline (tablet/laptop/etc.) access!

Pearson IT Certification

Pearson are having the same Cyber Monday Sale as Cisco Press with 55% off any digital items. On their site you’ll find not only tech books from Cisco Press but also VMware Press,  and others, and of course video training, practice exams, and more.  If you miss this sale, they also consistently offer eBook and Video Deals of the Week (different from the ones on the Cisco Press site).

Training

GNS3 Academy

You may know GNS3 as the best vendor-neutral networking simulator around, but did you realize they also offer training? This year they’re offering a Black Friday sale where all of their courses (normally priced between $19 – $49) are only $15 using coupon code BLACKFRIDAY. They also have several free courses to check out at any time.

INE

If you’re ready to take the leap for your CCIE, check out INE‘s Cyber Monday Sale.  They’re offering 3 deals: 33% off their Routing & Switching Everything Bundle, 50% off rack rental tokens, and 20% off INE apparel.

Pluralsight

The company offering the best catalog of tech video training – by some of the best, most knowledgeable instructors – are going to be offering a Cyber Monday sale, too. What is it? They still haven’t announced it, but given that a Pluralsight subscription (as low as $299/year)  is tied with SafariOnline for the best tech learning value per dollar, you’re going to want to check back to see what deals they’re offering!


SafariOnline

Yes, this is a double listing, but only because Safari does include a number of video training classes in their inventory – and because at $199 a Safari subscription is an incredible deal!

Unrelated Good Deal

SpiderOak

My favorite backup/synch service is offering their unlimited plan for only $149/year as a Cyber Monday deal (until December 1st). SpiderOak combines the granual backup of products like CrashPlan with the synch capabilities of Dropbox, but with a core focus on zero-knowledge security and privacy. If you value your data – and the privacy of that data – you should seriously think about using them.


Take advantage of everything that’s out there, and get prepared for annother year of learning and growth!

Kicking the Tires: VMware vCloud Air OnDemand

Before We Begin

Cloud Computing. The Cloud. Private Cloud. Public Cloud. Hybrid Cloud.Cloud apps. Cloud platforms. Cloud automation. Cloud bursting. Intercloud. Multicloud. Cloudcloudcloudcloudcloudcloudcloudcloud

CloudAgain

Ok, enough of that, then.

Private and Public

VMware, as everyone know, is the 800 pound gorilla of infrastructure virtualization, of Infrastructure-as-a-Service, of private cloud. Despite this,  and despite VMware’s aggressive pursuit of being more than just the King of Virtualization, it has not historically been focused on, or a leader in, public cloud.

Clearly, Amazon Web Services is the 800 pound – nay, 800 ton – gorilla of public cloud.  Why? A number of reasons: early market entry, parent brand recognition, aggressive pricing, sustained investment,  and many others. But the biggest reasons are almost certainly the simplest: speed and ease. A relative novice can quickly setup an AWS account and within a few minutes have a virtual machine running on the Internet – all payment taken care of easily via credit card and all charges based on a simple utility usage model. Pay for what you use when you use it, and by how much of it you use. If you use it less, you pay less, and if you don’t use it at all then you don’t pay anything.

If you’re reading this, you’ve undoubtedly used AWS yourself and understand this well. If you haven’t actually gotten your hands wet, you should and you can – just go sign up for the AWS Free Tier for a year and see for yourself: http://aws.amazon.com/free/.

A Step In the Right Direction

VMware’s initial foray into public cloud with vCloud Hybrid Service, now renamed as vCloud Air, was fairly self-explanatory and focused on offering hybrid cloud services where a customer’s private cloud (already running on vSphere) could be expanded and extended into a cloud provider’s infrastructure (in this case VMware’s). Built on vSphere and vCloud Director, it was a powerful platform that leveraged a company’s existing familiarity and trust with VMware’s products to (relatively) easily work with off-prem infrastructure services. It just wasn’t really public cloud , nor were the acquisition & usage models the same: you couldn’t just go sign up with a credit card, and your billing would follow a subscription model for blocks of resources (like your cable TV bill) rather than only actual resources used (like your utility bill).

Now VMware is expanding to provide a true public cloud experience with the development of vCloud Air OnDemand: a pay-as-you-go cloud utility service aimed more squarely at AWS and other public cloud service providers. I was fortunate enough to be selected as an early access participant through the vCloud Air OnDemand Ambassador program, and got to play a bit with it.

ondemand-ambassador-stamp-Eric-Railine

Clouds in the Air

In a nutshell: it’s pretty darn good. It certainly looks a lot nicer, cleaner, and more professional than AWS, and it provides a much needed simplified UI in front of vCloud Director (though direct access to the vCD UI is also available throughout the vCloud Air UI for those more comfortable with it or who need to use some of the more advanced features and configurations).

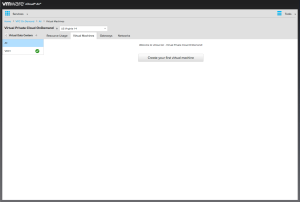
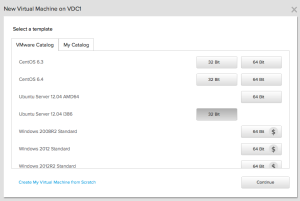
The initial setup is straightforward: login, click on “Virtual Private Cloud OnDemand”, choose your first datacenter to place your workload, and begin provisioning virtual machines.

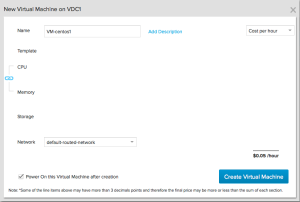
The wizard for creating your VMs is simple and straight forward, and provides detailed visibility into the costs associated with your configuration choices. You can look at either the per-hour or  the per-month cost for the VM, and tweak the setting to your heart’s – and bank account’s – content.

You can also create a VM “from scratch” outside of this simple wizard, which will bounce you out to the vCloud Directory UI instead where you can build new vApps as custom as you like, or import existing vApps and OVFs.

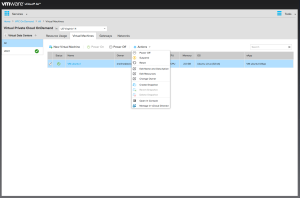
The on-going management dashboard is divided into Resource Usage (i.e. what you’re using & how much it’s costing you), Virtual Machines (the default tab you are taken to), Gateways, and Networks. The majority of your daily VM operations are easily done from here.

Manage_VM

Quibbles and Nits

It’s the little things that trip you up: the untied shoelace, the toy in the wrong place, the step that you didn’t see. Despite the polished look of the vCloud Air interface, there were a number of things that proved annoying or made the product more difficult to work with than it needed to be:

  • Root passwords: If you use any of the pre-created operating systems in the catalog, the automation will set a new random root password (and provide that password to you in the interface) which you then need to change upon login. Seems reasonable, right? Except that every VM I created this way would never take the new password but would instead return to the login prompt without the change taking effect. Over and over. I tried this with different choices (CentOS 6.3 64-bit, CentOS 6.4 32-bit, Ubuntu Server 12.04 64-bit, Ubuntu Server 12.04 32-bit) across different datacenter locations (US Virginia 14, US California 13) with no difference in behavior. An easy workaround is to simply boot into single user mode, enter the  random password, and then manually change using the ‘passwd’ command. Easy, but annoying (and not an issue I’ve encountered with images from AWS, Digital Ocean, etc.).
  • Intermittently, the web UI would display incorrectly – usually either calculated fields wouldn’t update automatically or in some cases fields simply wouldn’t display, like this one:

UI_error

  • Help and Support: Choosing the Help option from the upper-right menu takes you to the vCloud Air Documentation Center, which is very good. Choosing the Support Center option takes you to the vCloud Air Support Center – which looks good, but any searches are run against the entire VMware support site and not filtered by (or at least sorted for) vCloud Air. Worse, there’s no  option for vCloud Air in the product list on the left for the user to filter their own results.
  • Internet access:  I’ll go out on a limb & say that in the vast majority of cases, users will need a newly-created VM to be able to access the Internet (for OS updates or software installation if nothing else). For most public clouds, including AWS, the default state of a new VM is Internet-accessible, including inbound access. Yet here it’s not enabled by default, there’s nothing presented in the UI to configure it simply (it’s actually a three step process), and how to do so is semi-buried in the documentation where it is not really clearly described.

In the end, the above are just unnecessary friction for an otherwise slick and powerful product.

Verdict

VMware has done a good job of moving into the utility cloud space with OnDemand. If you’re looking for a cloud service built on the most enterprise-class virtualization products available, run by the company that built those products, and which can allow seamless import/export between the cloud service and your existing private cloud – you want vCloud Air. If you want the power of vCloud Director yet with a simpler interface, you want vCloud Air. And if you want the speed and ease of AWS with the same technology you’re used to in your datacenter, you want vCloud Air OnDemand.

And like AWS, it’s easy to try – just go sign up for an account and get $300 in service credits for the first 90 days!


Tours of the Black Prompt: NetApp FAS Service Processors

The Tours of the Black Prompt series so far:

Over the course of this series, we’ve focused on the command line interface available for the operating systems that run on NetApp FAS storage array controllers: Data ONTAP 7-mode and clustered Data ONTAP. In this post, we’ll focus on a CLI that is not part of the operating system: the Service Processor shell.


Service Processor Shell

NetApp FAS array controllers have had built-in out-of-band management for many years. Depending on the series, older FAS models have used either baseboard management controllers (BMC) or remote LAN management (RLM) ports for this functionality. The newer FAS models, including the 2200, 3200, 6200, and 8000 series, all use a service processor (SP) for out-of-band management. BMCs, RLMs, and SPs offer similar base functionality, but SPs provide the most capabilities and features. The SP CLI behavior described below is the same regardless of whether the controller connected to the SP is running 7-mode or clustered Data ONTAP.

Commands and Privilege Levels

Logging in via SSH (telnet is not supported) you are provided a simple administrative-level prompt:

SP>

The prompt is very minimal and only indicates that you are connected to a Service Processor (the “SP” in the prompt) at the normal administrative privilege level (the “>” in the prompt). This is of course very similar to the Data ONTAP shell prompts but without the cluster or hostname being designated.

From here, you can see the available command structure by simply typing either “?” or help followed by [Enter] :

SP> ?
 date - print date and time
 exit - exit from the SP command line interface
 events - print system events and event information
 help - print command help
 priv - show and set user mode
 sp - commands to control the SP
 rsa - commands for Remote Support Agent
 system - commands to control the system
 version - print Service Processor version
 
SP> help
 date - print date and time
 exit - exit from the SP command line interface
 events - print system events and event information
 help - print command help
 priv - show and set user mode
 sp - commands to control the SP
 rsa - commands for Remote Support Agent
 system - commands to control the system
 version - print Service Processor version

As you can see, there are far fewer commands available for the SP than there are for either version of Data ONTAP. The SP CLI is limited to functionality necessary or useful for situations that require out-of-band access.

For the vast majority of times that an administrator will be connecting to the Service Processor, they will be using it for the most basic functionality: serial console access using the system console command.

SP> system console
 Type Ctrl-D to exit.
 SP-login: admin
 Password:
 *****************************************************
 * This is a SP/RLM console session. Output from the *
 * serial console is also mirrored on this session.  *
 *****************************************************
cluster01::>

Connecting to the system console does require a secondary authentication. While the built-in admin or root user (depending on the version of Data ONTAP) are allowed to login to the SP by default, it is possible for other users to be configured for access to the SP who may or may not be allowed console access to Data ONTAP.

At this point, the SP session will be able to see all output visible to the physical serial port, as well as being able to provide any input to it. Access via system console is not restricted or limited in any way; access and capabilities are only limited by the configuration of the user.

While the SP console session and the physical serial console session do display some of the same information, they still have separate and independent shell environments. If, while an SP session is connected to the system console, there is a concurrent connection to the physical serial port, any input or output from that console session would be mirrored to the SP session. The inverse, however, is not true: any input or output initiated from the SP session will not be visible to the physical console session.

Pressing Ctrl+d from the SP session will end the system console access and return the administrator to the SP CLI prompt.

cluster1::> SP>

The SP itself can also be accessed from the physical serial port by pressing Ctrl+g. This is useful where an administrator is using either a console/terminal server for centralized out-of-band management, or when connected directly to the console (such as during initial setup). The administrator can then return to the serial console by pressing Ctrl+d.

cluster1::>

Switching console to Service Processor
Service Processor Login:
Password:
SP>

cluster1::>

Just like Data ONTAP, there are two additional privilege levels available: advanced and diag. You can change to these levels using the priv set command.

SP> priv set advanced
 Warning: These advanced commands are potentially dangerous; use them only when directed to do so by support personnel.
 
SP*>

The asterisk between the “SP” and “>” indicates that you are in either the advanced or diag privilege level.  There is unfortunately no visual distinction between these two levels, but you can run the priv command with no modifiers to display the current privilege level. This is again just like with Data ONTAP.

SP*> priv
 advanced

More commands are available within the higher privilege levels than in the normal admin level, though they are not necessarily obvious from the top-level output.

Advanced
SP*> ?
 date - print date and time
 exit - exit from the SP command line interface
 events - print system events and event information
 help - print command help
 priv - show and set user mode
 sp - commands to control the SP
 rsa - commands for Remote Support Agent
 system - commands to control the system
 version - print Service Processor version

There are several commands available in Advanced level that aren’t in the normal Admin level, with most being for the display of additional information:

  • sp log audit to display the command history of the SP
  • sp log debug to display the debug information of the SP
  • sp log messages to display the contents of the messages file for the SP
  • system battery auto_update status to display the current setting for the battery firmware automatic updates
  • system fru log show to display the history log related to FRU data

There are also several commands to modify or verify the SP configuration:

  • system battery auto_update [enable|disable] to configure the setting for the battery firmware automatic updates
  • system battery verify [URL] to compare the current battery firmware image with another image available at the specified URL
  • system nvram flash clear to erase the NVRAM flash content (only available when the system is powered on)
Diag
SP*> priv set diag
 Warning: These diagnostic commands are for use by support personnel only.
 
SP*> ?
 date - print date and time
 exit - exit from the SP command line interface
 events - print system events and event information
 gdb - commands to control GDB pass-through
 help - print command help
 priv - show and set user mode
 sp - commands to control the SP
 rsa - commands for Remote Support Agent
 system - commands to control the system
 version - print Service Processor version
 ping - send ICMP ECHO_REQUEST packets to network hosts
 ping6 - send ICMPv6 ECHO_REQUEST packets to network hosts
 traceroute - trace route to HOST
 nslookup - query the nameserver for the IP address of the given HOST optionally using a specified DNS server

The most useful commands at the diag privilege level may be the most basic for troubleshooting network connectivity:

  • ping and ping6
  • traceroute
  • nslookup

Command Syntax and Help

You can see the syntax for a given command by passing it the “-?” or “?” flag, or by using the help command:

SP> events ?
 events all - print all system events
 events info - print system event log information
 events newest - print newest system events
 events oldest - print oldest system events
 events search - search for and print system events
 
SP> events -?
 events all - print all system events
 events info - print system event log information
 events newest - print newest system events
 events oldest - print oldest system events
 events search - search for and print system events
 
SP> help events
 events all - print all system events
 events info - print system event log information
 events newest - print newest system events
 events oldest - print oldest system events
 events search - search for and print system events

The information available for the SP CLI commands is not as verbose and detailed as for Data ONTAP, and manual pages are unfortunately not available. The best source of more information for SP commands will be found in the System Administration Guide for the appropriate Data ONTAP release.

Command Completion

Tab completion is not available for the SP CLI, nor can you abbreviate commands. All commands must be fully entered in order for them to be recognized.

Navigation and Editing

Command-line editing and navigation utilizes the standard keystrokes and combination previously discussed in CLI Efficiency: Common Basics

You can navigate through your previously entered commands using the up and down arrows, or by using Ctrl+n and Ctrl+p, but there is no history command for the SP CLI. It is also worth noting that SP commands entered prior to accessing a system console session will not be displayed after returning to the SP CLI prompt.

Just like with Data ONTAP, you can enter multiple commands on the same command line by separating each command with a semi-colon. The commands will then be executed in order of entry.

SP*> priv; date
 diag
 
 Sun Nov  30 02:10:02 GMT 2014

As you’ll have noticed, the Service Processor shell has an interface similar to and consistent with the Data ONTAP 7-mode shell despite the different use cases for each.

In a future article, I’ll go into more details around SP setup, configuration and usage beyond the basics described in this post.

Tech Smorgasbord #4

An on-going reference series for interesting technology or projects which deserve further investigation, or for technical documentation (of one media format or another) that looks to be especially good reference material.


Duarte Diagrammer

Nancy Duarte and her firm Duarte, Inc. specialize in helping people communicate better through more effective presentations. She’s probably best known for the book Slide:ology: The Art and Science of Creating Great Presentations which is frequently recommended to both novice and more seasoned public speakers.

Duarte Diagrammer is “a visualization system” that provides ~4,000 customizable diagrams to illustrate relationships, hierarchy, and process, with all of these diagrams being available to download as Microsoft PowerPoint files. The site has a very easy and simple interface for browsing the diagrams through categories such as Flow, Join, Network, Segment, and Stack, and then specifying further by style and number of nodes.

The only downside is that each diagram is a separate file to download, and there doesn’t appear to be any consolidated or collected files for groups of related diagrams.  This minor quibble aside, this is a fantastic resource for anyone creating or delivering presentations.


CloudBolt Command and Control (C2)

CloudBolt are billing their product as a “next-generation Cloud Manager” capable of managing and automating the entire breadth of an enterprise infrastructure including virtual environments, physical components, and multiple/hybrid cloud options. CloudBolt are trying to appeal directly to the business, and not (just) to the techies, by highlighting an IT self-service catalog and portal, chargeback and showback cost accounting, software license management, a Cloud Supply Chain Validator, and a rapid time-to-value (20 minute installs and an interface so simple and intuitive that advanced skills and professional services are unnecessary).

The marketing claims that CloudBolt C2 supports and integrates with

  • multiple hypervisors: VMware vSphere, KVM, XenServer (but not Hyper-V, interestingly)
  • multiple cloud platforms: Amazon Web Services, Microsoft Azure,Verizon Terremark, Google Compute Engine, OpenStack, and Nebula
  • multiple configuration management tools: Puppet, Chef, Infoblox, ServiceNow, etc.
  • multiple provisioning technologies: HP server automation, Cobbler, IPMI
  • multiple orchestration products: VMware vCloud Orchestration (sic), HP Operations Orchestrations

Like several other products I’ve come across lately, the CloudBolt website is very light on technical details or content, and while their benefits white paper says “we have made C2 Virtualization Edition freely downloadable, and included a no-cost license to manage up to 100 VMs,” this edition does require request approval before download access is actually granted. (I’ve just submitted a request and am now waiting for approval.)

On the plus side, Gartner has apparently included them in its “2014 Cool Vendor in Cloud Management” report, and educational software powerhouse Blackboard is providing a public reference for CloudBolt (though only a Proof of Concept is specifically mentioned).

Jonathan Frappier has already started documenting his experiences with CloudBolt C2 with two articles available now, and hopefully even more on the way.


How I Taught Myself to Code in 8 Weeks

I’m quite far from being a software developer, but the need for even the staunchest of infrastructure admins and engineers to learn skills typically associated with development is quickly gaining steam. We see it in the growing DevOps movement, the expanding usage and sophistication of automation and orchestration tools, and in the emphasis on programmability and related familiarity with scripting languages included in the marketing tsunami that is Software-Defined Everything.

In this article David Sinsky does a good job laying out a plan to go from near-zero software development experience to producing a working application prototype in eight weekends. Clearly, you won’t become a professional software engineer in this amount of time, but you can rapidly increase yourskillset to the point of usefulness within that span, as David tries to show. Chock full of useful links, this is both a good collection of resources to bookmark and a good plan for learning programing – or at least a good plan for learning Python and Django.


Tours of the Black Prompt: Clustered NetApp Data ONTAP – Part 6

The Tours of the Black Prompt series so far:

In this entry in the series, we’ll take a brief look at the different shells available within clustered Data ONTAP.

Clustershell

Everything we’ve discussed in Part 1 through Part 5 of this series has been using the clustershell. This is the primary interface for cluster management from the command line, and it is expected that the vast majority of the administrator’s work in the CLI will be using this shell (95%+). The clustershell is what the administrator is automatically using when connecting to a cluster, regardless of whether that connection is to the cluster management interface, a node management interface, or a Storage Virtual Machine management interface. The clustershell manages objects and configurations for the entire cluster.

Nodeshell

The nodeshell is a more limited shell for commands that only effect an individual node. This shell is equivalent to the one used for Data ONTAP operating in 7-mode where each controller operated as an independent node despite being able to provide high-availability for its partner.

Nodeshell commands are accessible from the clustershell using the system node run command (or any of its abbreviated forms like node run, run, or even ru). We’ve shown several examples of this usage over the previous five parts of this series.

You can see what commands are available in the nodeshell using either “?” or the help command:

cdot_mba1::> run local -command ?
 ?                   file                partner             software           
 acpadmin            flexcache           passwd              source             
 aggr                fsecurity           ping6               sp                 
 backup              halt                pktt                stats              
 bmc                 help                priority            storage            
 cdpd                hostname            priv                sysconfig          
 cf                  ic                  qtree               sysstat            
 clone               ifconfig            quota               timezone           
 date                ifgrp               rdfile              ups                
 dcb                 ifstat              reallocate          uptime             
 df                  key_manager         restore             version            
 disk                keymgr              restore_backup      vlan               
 disk_fw_update      license             revert_to           vmservices         
 download            logger              rlm                 vol                
 dump                man                 route               wcc                
 echo                maxfiles            rshstat             wrfile             
 ems                 mt                  sasadmin            ypcat              
 environment         ndmpcopy            sasstat             ypgroup            
 fcadmin             netstat             sis                 ypmatch            
 fcp                 options             snap                ypwhich            
 fcstat             
 
 cdot_mba1::> run local -command help
 
 ?                   file                partner             software           
 acpadmin            flexcache           passwd              source             
 aggr                fsecurity           ping6               sp                 
 backup              halt                pktt                stats              
 bmc                 help                priority            storage            
 cdpd                hostname            priv                sysconfig          
 cf                  ic                  qtree               sysstat            
 clone               ifconfig            quota               timezone           
 date                ifgrp               rdfile              ups                
 dcb                 ifstat              reallocate          uptime             
 df                  key_manager         restore             version            
 disk                keymgr              restore_backup      vlan               
 disk_fw_update      license             revert_to           vmservices         
 download            logger              rlm                 vol                
 dump                man                 route               wcc                
 echo                maxfiles            rshstat             wrfile             
 ems                 mt                  sasadmin            ypcat              
 environment         ndmpcopy            sasstat             ypgroup            
 fcadmin             netstat             sis                 ypmatch            
 fcp                 options             snap                ypwhich            
 fcstat             

The help command can also be used to get more information about a specific command, or you can pass the “-?” parameter to the command:

cdot_mba1::> run local -command help acpadmin
 
 acpadmin             - Storage ACP administrator functions

cdot_mba1::> run local -command acpadmin -?
 Usage: acpadmin configure
        acpadmin list_all
        acpadmin stats

Running just a command without parameters will actually provide the same information as using the “-?” parameter:

cdot_mba1::> run local -command acpadmin
 Usage: acpadmin configure
        acpadmin list_all
        acpadmin stats

As you may have noticed from our examples in the earlier parts of the series, you don’t need to use the “-command” parameter at all but can just specify the command directly:

cdot_mba1::> run local acpadmin
 Usage: acpadmin configure
        acpadmin list_all
        acpadmin stats

This works even for the help command to show the available nodeshell commands, though you can’t use the “-?” in the same fashion as it’s evaluated for the run local context instead:

cdot_mba1::> run local help   
 
 ?                   file                partner             software           
 acpadmin            flexcache           passwd              source             
 aggr                fsecurity           ping6               sp                 
 backup              halt                pktt                stats              
 bmc                 help                priority            storage            
 cdpd                hostname            priv                sysconfig          
 cf                  ic                  qtree               sysstat            
 clone               ifconfig            quota               timezone           
 date                ifgrp               rdfile              ups                
 dcb                 ifstat              reallocate          uptime             
 df                  key_manager         restore             version            
 disk                keymgr              restore_backup      vlan               
 disk_fw_update      license             revert_to           vmservices         
 download            logger              rlm                 vol                
 dump                man                 route               wcc                
 echo                maxfiles            rshstat             wrfile             
 ems                 mt                  sasadmin            ypcat              
 environment         ndmpcopy            sasstat             ypgroup            
 fcadmin             netstat             sis                 ypmatch            
 fcp                 options             snap                ypwhich            
 fcstat             
 
 cdot_mba1::> run local -?
   { [[-command] <text>, ...]  Command to Run
   | [ -reset [true] ] }       Reset Existing Connection

The nodeshell can also be used interactively by using the run clustershell command without appending a particular nodeshell command to run.

cdot_mba1::> run local                     
 Type 'exit' or 'Ctrl-D' to return to the CLI
 cdot_mba1-01> ?
 ?                   file                passwd              software           
 acpadmin            flexcache           ping                source             
 aggr                fsecurity           ping6               sp                 
 arp                 halt                pktt                stats              
 backup              help                priority            storage            
 bmc                 hostname            priv                sysconfig          
 cdpd                ic                  qtree               sysstat            
 cf                  ifconfig            quota               timezone           
 clone               ifgrp               rdfile              traceroute         
 coredump            ifstat              reallocate          traceroute6        
 date                key_manager         restore             ups                
 dcb                 keymgr              restore_backup      uptime             
 df                  license             revert_to           version            
 disk                logger              rlm                 vlan               
 disk_fw_update      man                 route               vmservices         
 download            maxfiles            rshstat             vol                
 dump                mt                  sasadmin            wcc                
 echo                ndmpcopy            sasstat             wrfile             
 ems                 ndp                 savecore            ypcat              
 environment         netstat             shelfchk            ypgroup            
 fcadmin             options             sis                 ypmatch            
 fcp                 partner             snap                ypwhich            
 fcstat             
 cdot_mba1-01>

Notice that the prompt changes once you’ve entered the nodeshell, and uses the same format as the 7-mode prompt (nodename followed by “>”).

 cluster01> priv set advanced
 Warning: These advanced commands are potentially dangerous; use
          them only when directed to do so by NetApp
          personnel.
 cdot_mba1-01*>

The same privilege levels (admin, advanced, and diag) are still applicable within the nodeshell, and the same indicators are used (the presence of the “*” between the nodename and the “>” indicates that the administrator is in either advanced or diag privilege level).

You return to the clustershell by typing exit or pressing Ctrl+d.

cdot_mba1-01*> exit
 logout
 
 cdot_mba1::>

While in the above example we were connecting to the nodeshell of the local node (the node where the cluster management interface was currently located), the administrator can connect to any node in the cluster as needed:

cdot_mba1::> run -node cdot_mba1-02
 Type 'exit' or 'Ctrl-D' to return to the CLI
cdot_mba1-02>

If you are connecting via the cluster management interface, you can identify which node you are connected to by finding the current home of the interface:

cdot_mba1::*> net int show cluster_mgmt
   (network interface show)
             Logical    Status     Network            Current       Current Is
 Vserver     Interface  Admin/Oper Address/Mask       Node          Port    Home
 ----------- ---------- ---------- ------------------ ------------- ------- ----
 cdot_mba1
             cluster_mgmt up/up    172.16.213.10/24   cdot_mba1-01  e0d     false

But there’s also a much simpler way using a nodeshell command:

cdot_mba1::*> run local hostname
 
 cdot_mba1-01
One final note: just as with the 7-mode shell, tab completion will not work for nodeshell commands, even when run from the clustershell rather than interactively.

Systemshell

The systemshell is a lower-level shell that provides access to the underlying FreeBSD layer of Data ONTAP, and is meant only for diagnostic or troubleshooting purposes. The systemshell should only be used under the guidance of NetApp technical support, particularly for production systems.

The systemshell can only be accessed from the diag privilege level.

cdot_mba1::> systemshell
 
 Error: "systemshell" is not a recognized command
 
 cdot_mba1::> set -priv diag
 
 Warning: These diagnostic commands are for use by NetApp personnel only.
 Do you want to continue? {y|n}: y
 
 cdot_mba1::*> systemshell
   (system node systemshell)
 
 Data ONTAP/amd64 (cdot_mba1-01) (pts/2)
 
 login: admin
 Password:
 Error: Account not configured to connect in this manner.
 
 
 cdot_mba1::*>

The systemshell does require explicit re-authentication, and by default the admin user is not allowed access. You need to login as the diag user instead which needs to be given a password and unlocked before it is usable.

cdot_mba1::*> security login password -username diag 
 
 Enter a new password:
 Enter it again:
 
cdot_mba1::*> security login unlock diag
 
cdot_mba1::*> systemshell
   (system node systemshell)
 
 Data ONTAP/amd64 (cdot_mba1-01) (pts/2)
 
 login: diag
 Password:
 
 
 Warning:  The system shell provides access to low-level
 diagnostic tools that can cause irreparable damage to
 the system if not used properly.  Use this environment
 only when directed to do so by support personnel.
 
 cdot_mba1-01%
The systemshell does not provide the same level of friendliness as the other shells, as the “?” and “help” options are not supported, and neither is tab completion.
cdot_mba1-01% echo $SHELL
 /bin/csh
cdot_mba1-01% pwd
 /var/home/diag
cdot_mba1-01% ?
 ?: No match.
cdot_mba1-01% help
 help: Command not found.
cdot_mba1-01% exit
 logout
 
 cdot_mba1::*>

Again, the systemshell is only to be used under the supervision of NetApp technical support while performing troubleshooting or diagnostic operations.


There is in fact one more shell that an administrator will interact with, and it’s used with both clustered Data ONTAP and 7-mode. The Service Processor shell runs on an independent sub-processor used only for out-of-band management, and accessible via a dedicated Ethernet interface. We’ll discuss it in detail in an upcoming post.